Oskari admin tools have renewed so here is a tutorial for adminstrators
In the video there is a tutorial and tests for the relatively new admin side tool in Oskari.
You can test admin-side tools with Oskari demo site which is an Oskari set-up that everyone can try out without their own Oskari installation. Access the admin tool by logging in and use the test passwords, found actually from the start help. Remember that all information is deleted from the demo site during the night, so don’t store any crucial datasets there.
Prerequisities for administrators: you have to have some knowledge on OGC standards like WMS and WFS.
Supported map layer types
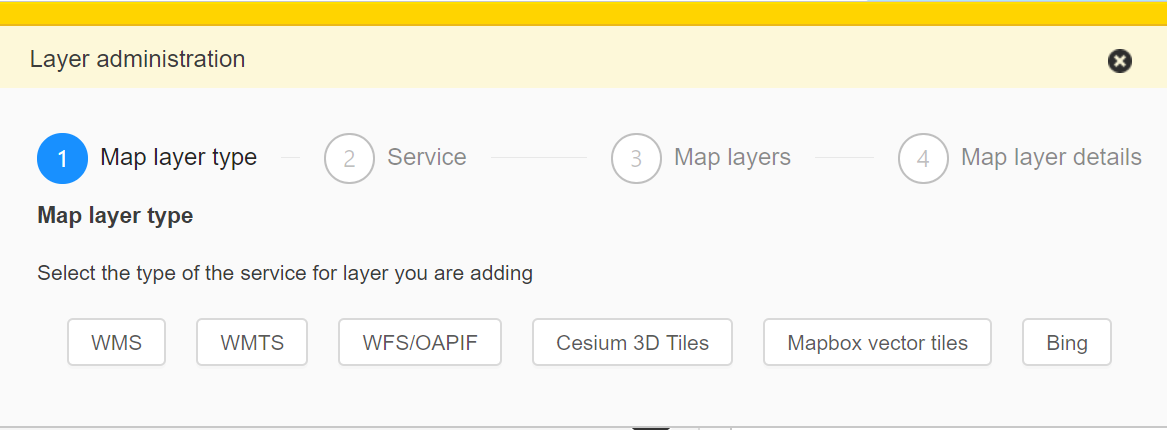
Oskari supports different standard interfaces like Web Map Service, Web Map Tile Service, Web Feature Service. And you can also add layers from Bing or services providing Mapbox vector tiles or Cesium 3D-tiles. If these are not familiar to you, we suggest you read on how to create WMS-services with GeoServer or similar map server. In short, there are different ways to provide interfaces for your data.
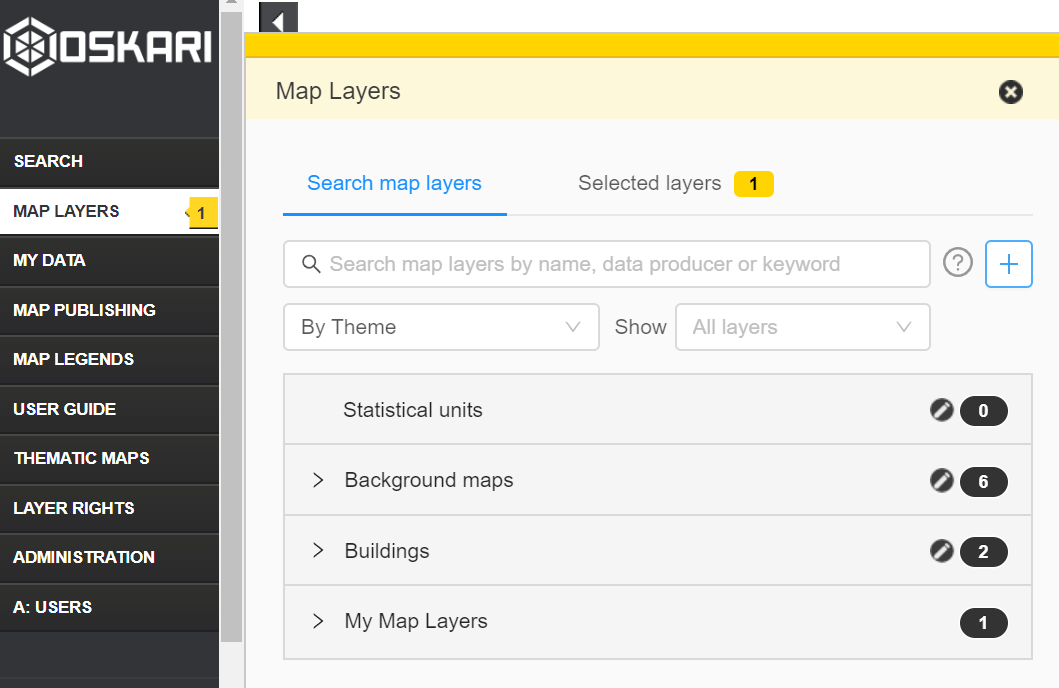
1. Adding data providers and themes
Oskari is originally created for geoportal purposes, so all the datasets should have a data provider and also some kind of category or theme.
When you are logged in you can add data providers, themes and data thourgh map layers window by clicking the + button.
2. Adding a basic information from a WMS/WFS layer
Test data used in the video:
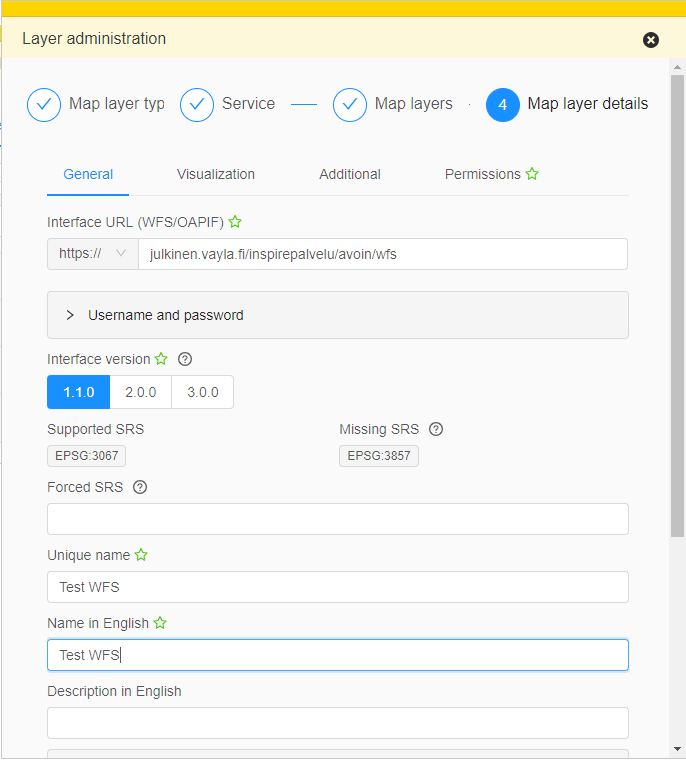
- Add an URL link for your WMS/WFS and passwords if needed
- Select the correct version for the WMS/WFS
- Browse through or find the wanted map layer with search (usually there are lot of layers to choose from in a single service)
- Set the SRS (coordinate system) or leave it as it is.
- The name of the dataset should come straight from the GetCapabilities query but you can also change the default names
- You can also add different translations for your dataset if your Oskari installation supports several languages
- Select the data provider and theme/group
- Finally, do not finish yet but go up the form and proceed in to the next sheet
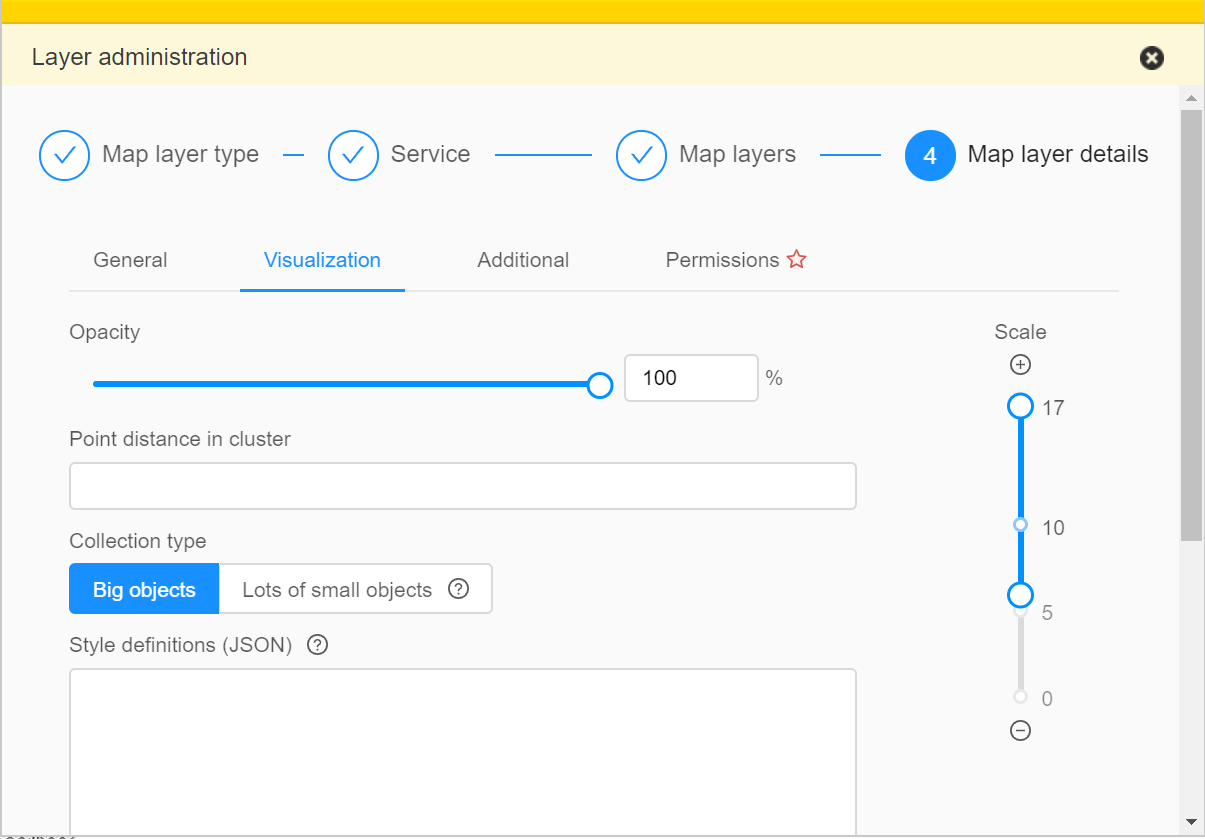
3. Visualisation possibilities
For WMS data the only option is to select default value for transparency (the user can adjust this at runtime).
For WFS data you can have more options:
- Try data clustering for points, by adding some point distance for points you want to cluster.
- Select if data with lots of small items should be optimized for browser (MVT) or just use GeoJSON as the default safe option
- Style definitions with JSON: own styling for WFS-datasets
- Feature highlighting and tooltip with JSON: own styling
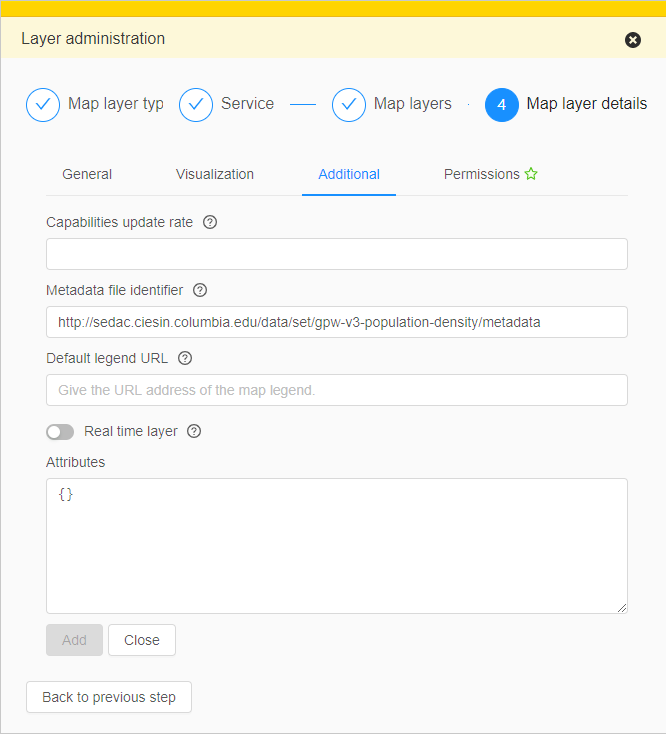
4. Additional information
In the next sheet, you can assign some additional information. For WMS and WFS there are slightly different options.
- Update rate for capabilities (in seconds), this is for e.g. datasets that need to be refreshed often like timeseries information
- Metadata link, in some cases it is already attached to the WMS/WFS GetCapabilities request
- For WMS layers you can add an other legend URL, if you don’t want to use the dataproviders own legend
- Real time layer for datasets that have data that is updated on the map frequently (like moving busses or weather data)
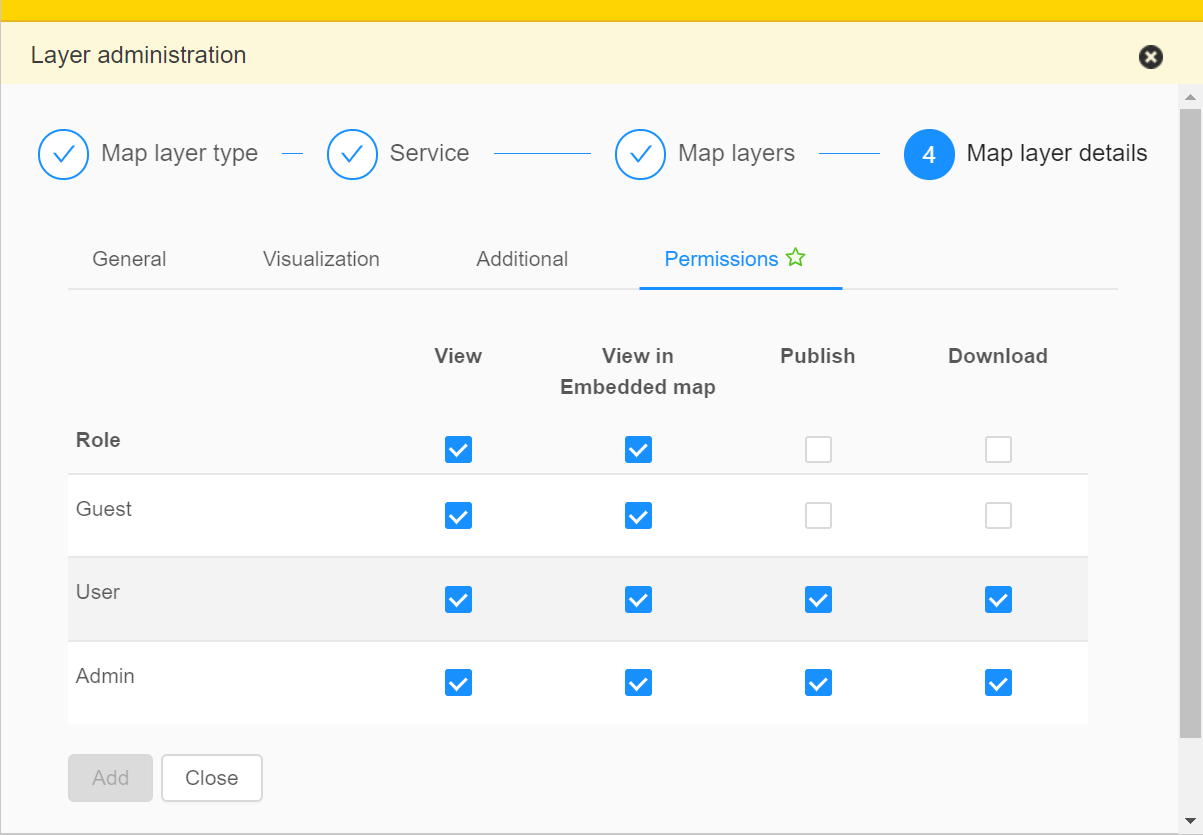
5. User rights
You can assign role-based access rights for your map layer for adminstrators, guests and signed in users.
- View: layer visibility can be restricted to a certain user group.
- View in embedded map: this option refers to the embedded map and tells if the data can be only viewed within the embedded map.
- Publish: you can also add restrictions for using the layer in question in published maps
- Download: this possibility is actually used only for WFS data, it allows downloading the attribute data in CSV or Excel format.
6. Finally: Add the layer to your map
And check if everything is ok. You can always edit the layer information from Map Layers if the pen-tool is active and you are logged in.
7. Extra: Adding 3D dataset from Cesium
In the video we tested also how to add 3D data from Cesium to the map. You need to sign in to Cesium and find e.g. OpenStreetMap Buildings asset id and you need a token.
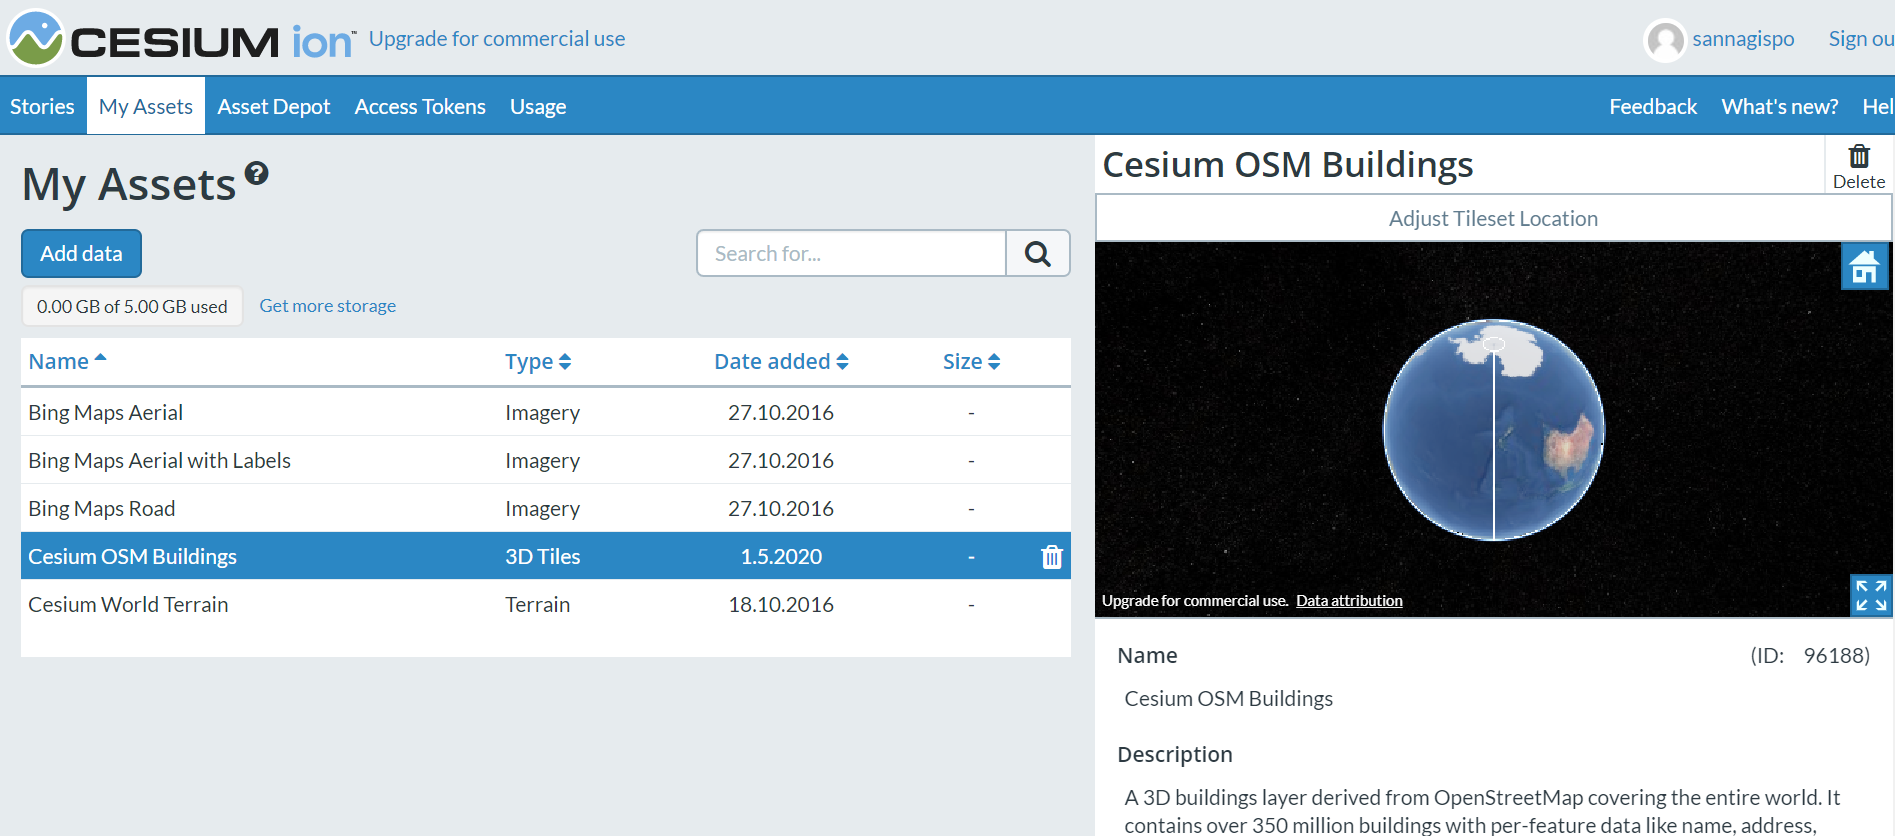
- Add a new layer and choose Cesium
- Add the Asset ID
- Add Access Token
- Add necessary information, like layer name, data provider, theme
- Test in 3D view to see the dataset in action